Utilizing CloudWatch Internet Monitor with Amazon WorkSpaces Personal
Utilizing CloudWatch Internet Monitor with Amazon WorkSpaces Personal
Author: Asriel Agronin
Published on: 2024-08-29 13:17:20
Source: Desktop and Application Streaming
Disclaimer:All rights are owned by the respective creators. No copyright infringement is intended.
At AWS re:Invent 2022, AWS launched Amazon CloudWatch Internet Monitor, which includes integrations with Amazon WorkSpaces Personal. After you associate your WorkSpaces with Internet Monitor, you can identify potential performance and internet connection issues of your users to their WorkSpaces. The service provides you with IP prefixes and ASN (typically, the internet service provider or ISP), which can be helpful to diagnose these issues. You can also use this data to view your fleet as a whole and monitor your WorkSpaces user connections. In this blog post we’ll show you, as a WorkSpaces administrator, how to use these critical pieces of information. Specifically, we’ll show you how to do the following:
- Build an Amazon CloudWatch dashboard that provides insights into Internet Monitor.
- Build a second dashboard that enables you to gain insights into which WorkSpaces might be impacted by an ISP issue.
- Adapt one or more of the following PowerShell samples to gather information:
- An example to enable you to see current health events.
- An example that enables you to get location details about where WorkSpaces are connected from.
- An example that shows WorkSpaces and user details currently impacted by an event.
Internet Monitor with Amazon WorkSpaces provides you with new insights where you can quickly determine things such as:
- Where users, connected to WorkSpaces, are located.
- Which ISPs users are using to connect to WorkSpaces.
- Which users are currently connected from a specific, geographic location.
- Which users might be impacted by an ISP outage.
- What platforms are being used to connect into WorkSpaces.
- Which associated WorkSpace IDs are being used to connect to WorkSpaces by an out-of-date client.
Prerequisites
Before you get started, review the following prerequisites:
Build a dashboard with WorkSpaces information
To help you easily view and query for WorkSpaces user information based on IP address, city, Autonomous System Number (ASN), or country, we’ve created an AWS CloudFormation template that you can use to gather details. In addition, by using the dashboard created by the template, you can see average latency as well as view an experience score, based on your selections. This template pulls multiple pieces of data into a single pane of glass easing the burden for WorkSpaces administrators.
To get started, download the CloudFormation template, and deploy the stack in your environment. See Creating a stack on the AWS CloudFormation console for more information on deploying a CloudFormation stack. Then, filter and sort by one or more fields to see the details you’re interested in.
After you deploy the stack, you’ll see the information in a dashboard, (Figure 1).
Dashboard to get the WorkSpace IDs by IP address

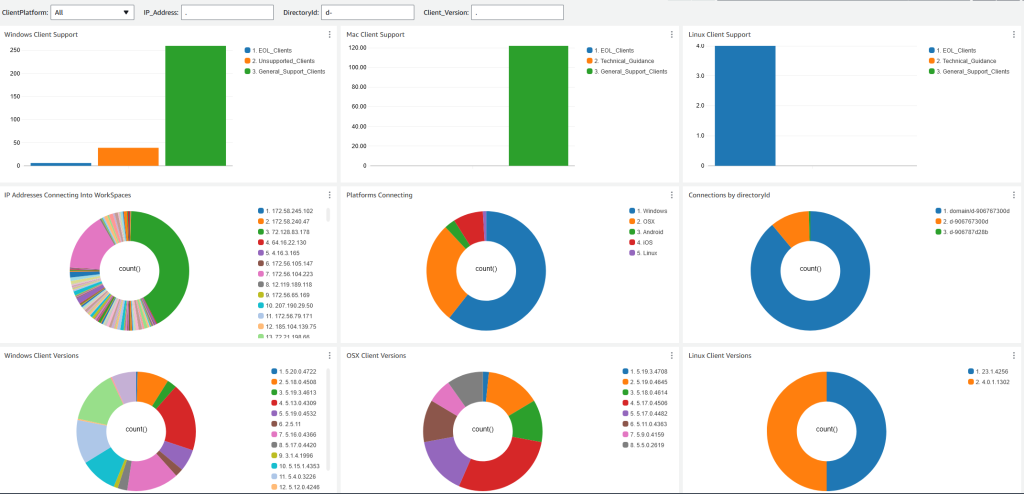
Figure 2: Screenshots showing examples of the dashboard that the second CloudFormation stack creates.
You can use another CloudFormation template to create a second dashboard providing details on WorkSpaces IDs that have connected from specific IP addresses. Using this dashboard, you can filter on client versions and platforms that are being used to access your WorkSpaces. Once you have deployed the template, filter and sort by one or more fields, to see the details. Once configured, you’ll see data like that in figure 2.
PowerShell samples to get detailed usage information
We’ve created a PowerShell module, which we provide in our Git repository, that you can use to get detailed information about your WorkSpaces usage.
The first example helps you to quickly gather information on a health event. Internet Monitor creates a health event to alert you to a specific problem that affects your users. You can view details to learn more about the specific location and users impacted. You can learn more about health events, including when Internet Monitor creates and ends health events, in the user documentation.
Download and run Get-ConnectedWSLocations, to see information on current health events that might be impacting your users. When you run the PowerShell command provide the Region for capturing data.
Get-CWIMHealthAlerts -region us-east-1 -CSVOutput $true
The following screenshot (Figure 3) shows an example of output from this PowerShell example.

Figure 3: Example output from the first PowerShell example.
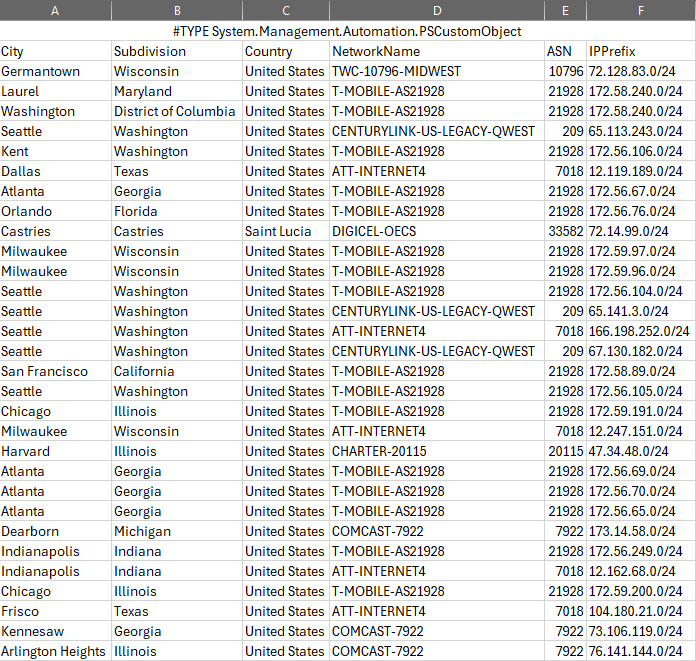
The second PowerShell example provides a list of locations that your WorkSpaces users are connecting from. When you run the PowerShell, provide the Region, the Internet Monitor log to use, and the duration (in hours, prior to the current time) for capturing data.
Get-ConnectedWSLocations -LogGroup "/aws/internet-monitor/WorkSpaces/byCity" -region us-east-1 -CSVOutput $true -TimeinHours 2184 -queryTimeout 30
The following screenshot (Figure 4) shows an example of output from this PowerShell example.

Figure 4: Example output from the second PowerShell example.
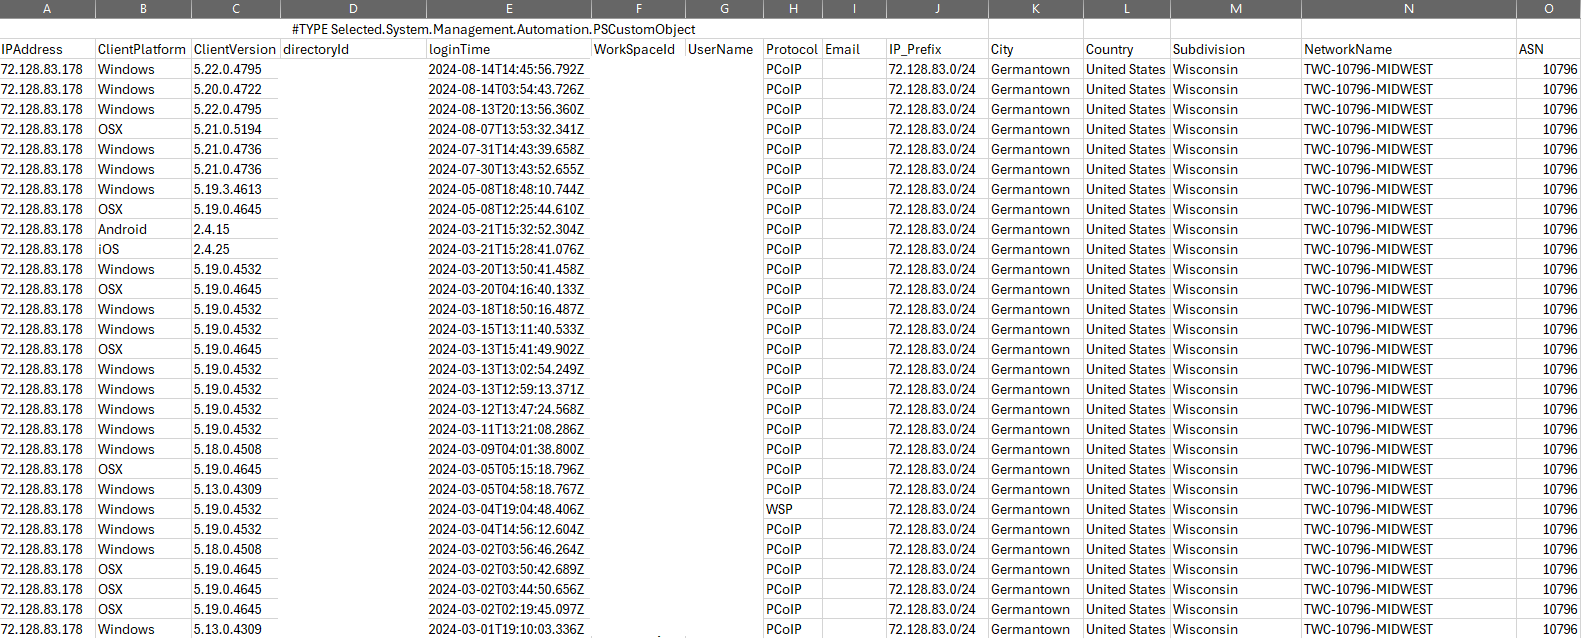
Finally, we have a third PowerShell example that helps with the scenario where customers want details on the WorkSpaces and where they are connecting from. For example, if there is an Internet connection issue, being able to proactively get the users impacted and potentially provide notifications.
To use the function, download the source from GIT and run the function similar to this example:
Get-ImpactedWorkSpaces -IP "12.168.1" -CWIMLogGroup "/aws/internet-monitor/WorkSpaces/byCity" -WorkSpaceAccessLogGroup "/aws/events/WorkSpacesAccessLogs" -region us-east-1 -CSVOutput $true -TimeinHours 2184 -queryTimeout 30
The following screenshot (Figure 5) shows an example of output from this PowerShell example.

Figure 5: Example output from the third PowerShell example.
Cleanup
In order to remove the dashboards we created during the previous steps, delete each CloudFormation stack. See Deleting a stack on the AWS CloudFormation console for more information on this procedure. Be sure to delete any csv files you saved when running the powershell scripts.
Summary
In this blog, we describe how you can utilize Internet Monitor with WorkSpaces Personal to track health events. We showed you how to get information that you can use to better understand how users are connecting and if they are impacted by any network events. We also explained how to use CloudWatch dashboards and PowerShell commands with dynamic variables to get information about the ISPs that your customers use and detailed information on user connectivity. Use these dashboards and PowerShell samples to get started with Internet Monitor and Amazon WorkSpaces today.
 |
Asriel Agronin is a Senior End User Computing Solutions Architect. He works with Federal customers designing and architecting EUC solutions on AWS. He has been with AWS since 2017. In his free time, you can find Asriel scuba diving, traveling, or playing chess. |
 |
Dave Jaskie brings 15 years of experience in the End User Computing space. Outside of Work, Dave enjoys traveling and hiking with his wife and 4 kids. |
 |
Anupam Anand is a senior Product Manager with the Network Availability Engineering team at Amazon Web Services. Anupam focuses on contributing to the design of product strategies and requirements that effectively meet the needs of customers. Anupam is based out of Seattle, USA. Outside of work, he loves playing badminton, cooking, and spending time with his family. |
Disclaimer: All rights are owned by the respective creators. No copyright infringement is intended.


